In the fast-paced world of cryptocurrency, the ability to interpret and analyze price charts is a valuable skill for investors and traders alike. Technical analysis is a widely used approach that allows individuals to make informed decisions based on historical price data and patterns. In this article, we will break down the basics of understanding crypto charts and delve into the fundamentals of technical analysis for digital currencies.
What are Crypto Charts?
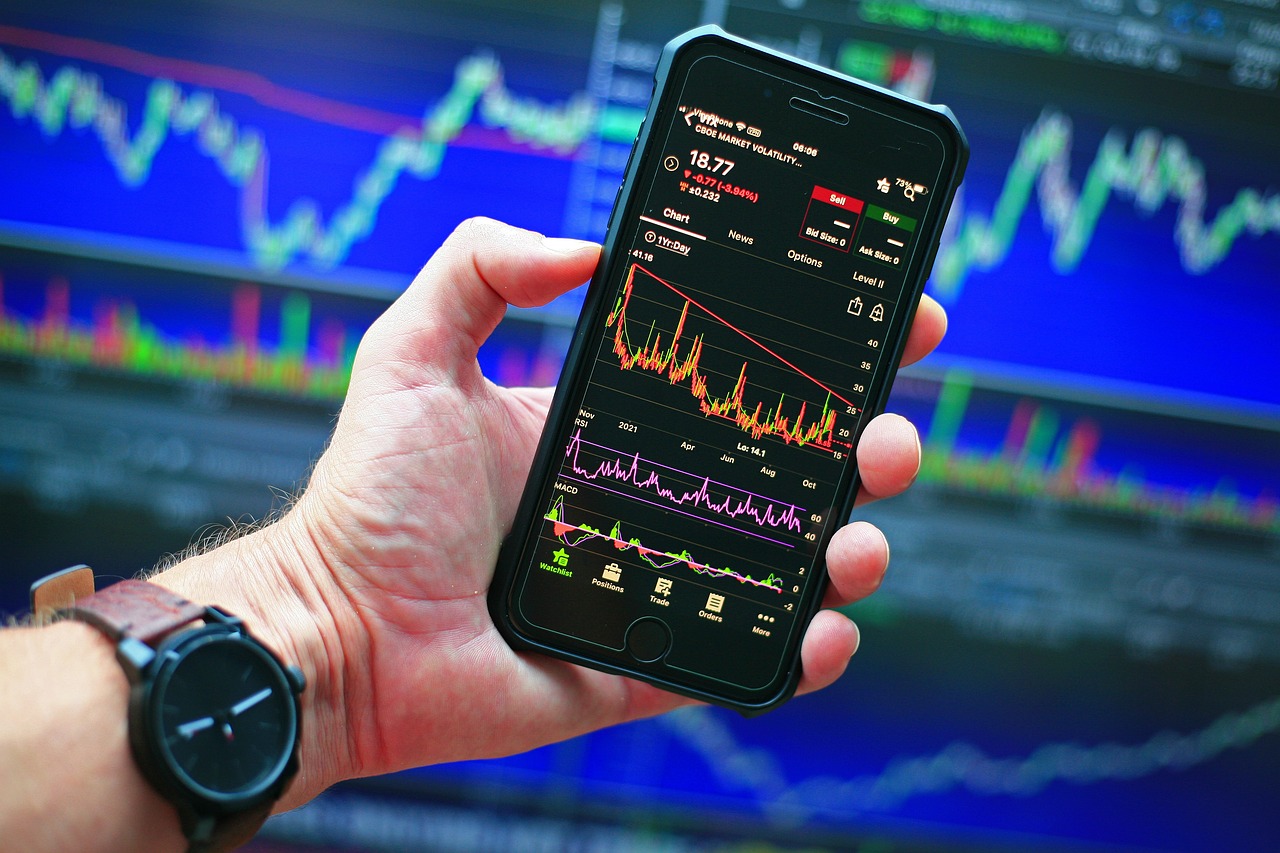
Crypto charts, also known as price charts or trading charts, display the historical price movements of cryptocurrencies over a specific time period. These charts provide valuable insights into the market sentiment, trends, and patterns that can help predict future price movements. By understanding and analyzing crypto charts, traders can make more informed decisions about buying, selling, or holding digital currencies.
Candlestick Charts: The Building Blocks
The most commonly used chart type in crypto trading is the candlestick chart. Candlestick charts provide a visual representation of price movements within a specified timeframe. Each candlestick represents a specific period, such as minutes, hours, days, or weeks, depending on the chosen timeframe.
Each candlestick consists of four main components: the opening price, closing price, highest price (also known as the high), and lowest price (also known as the low). The body of the candlestick is determined by the opening and closing prices, while the wicks or shadows represent the highest and lowest prices during that period.
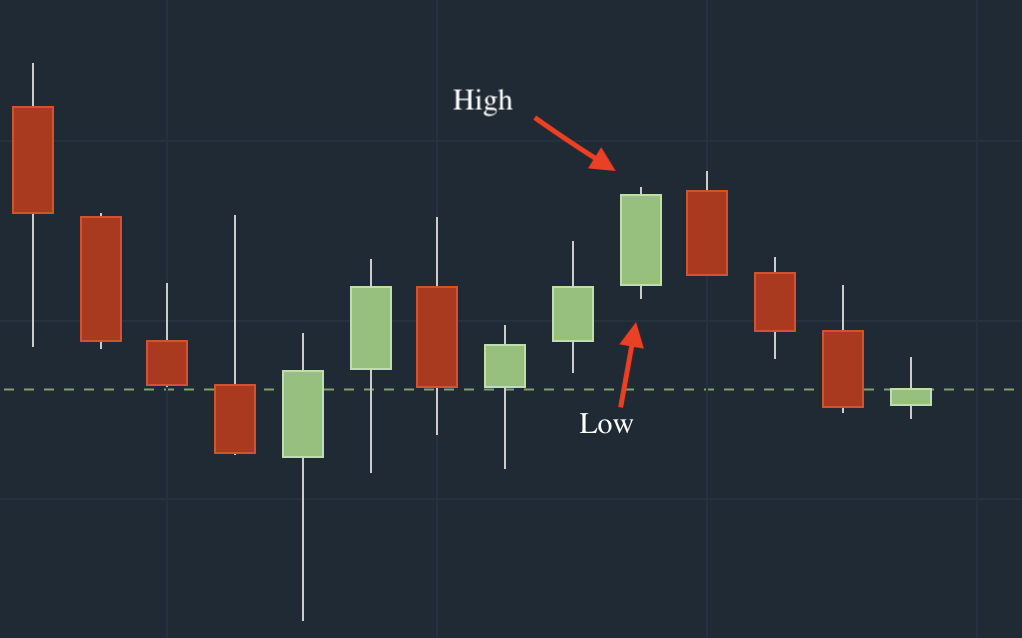
(Chart from TD365)
Support and Resistance Levels
Support and resistance levels are essential concepts in technical analysis. Support refers to the price level at which a cryptocurrency has historically had difficulty falling below, as buyers typically emerge and prevent further decline. Resistance, on the other hand, is the price level at which a cryptocurrency has historically had difficulty rising above, as sellers tend to outnumber buyers.
Identifying support and resistance levels on a crypto chart can help traders anticipate potential price reversals. When the price approaches a support level, it may indicate a buying opportunity, as there is a higher likelihood of a rebound. Conversely, when the price nears a resistance level, it may suggest a selling opportunity, as the chances of a price decrease are greater.
Trends: Riding the Waves
Trends play a crucial role in technical analysis and can be classified as either uptrends, downtrends, or sideways trends. An uptrend occurs when a cryptocurrency’s price forms a series of higher highs and higher lows. Conversely, a downtrend is characterized by lower highs and lower lows. A sideways or horizontal trend indicates a period of consolidation, with the price moving within a relatively narrow range.
Identifying and understanding trends is vital for traders, as it can help them determine the overall direction of the market. By aligning their trades with the prevailing trend, traders increase their chances of making profitable decisions.
Indicators: Adding Depth to Analysis
Technical indicators are mathematical calculations applied to crypto charts to provide additional insights into price movements. These indicators help traders identify potential entry and exit points and provide confirmation for their trading decisions.
Some commonly used indicators in cryptocurrency trading include moving averages (MA), relative strength index (RSI), and moving average convergence divergence (MACD). Each indicator has its own specific interpretation and can be used to analyze different aspects of price behavior, such as momentum, trend strength, and overbought or oversold conditions.
Conclusion
Understanding crypto charts and applying technical analysis is a valuable skill for anyone interested in trading or investing in digital currencies. By familiarizing yourself with candlestick charts, support and resistance levels, trends, and technical indicators, you can gain a deeper understanding of the market dynamics and make more informed decisions.
It’s important to remember that technical analysis is not foolproof and should be used in conjunction with other forms of analysis and risk management strategies. Crypto markets are highly volatile and can be influenced by various factors, so it’s crucial to stay updated on news and market developments.
With practice and continuous learning, you can develop your skills in interpreting crypto charts and gain a competitive edge in the dynamic world of digital currencies.